Introduction
S&OP (sales and operations planning) has never been more important in the wake of digitization. Some companies are trying to catch up with digitalization and some want to be the pioneer. In both cases, our DSML (data science and machine learning) platform will bring them a significant step forward. It’s all about faster and easier use of data science.
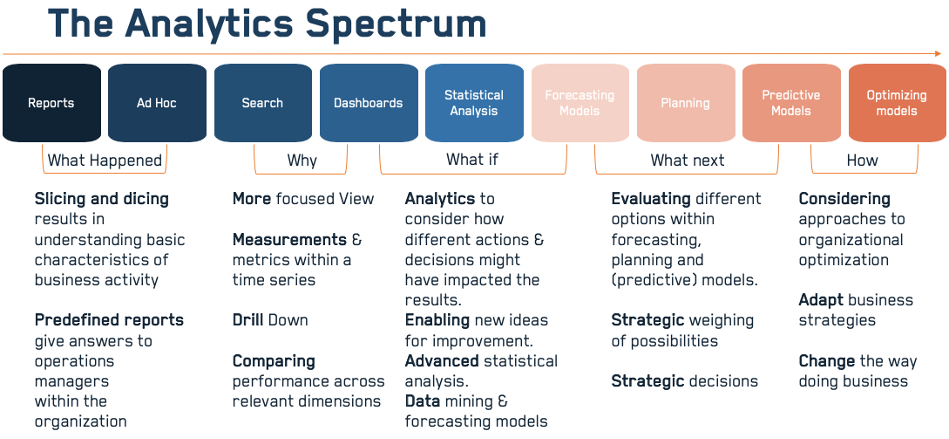
The platform covers the whole analytical spectrum, from descriptive and diagnostic to predictive and prescriptive.
Initial situation
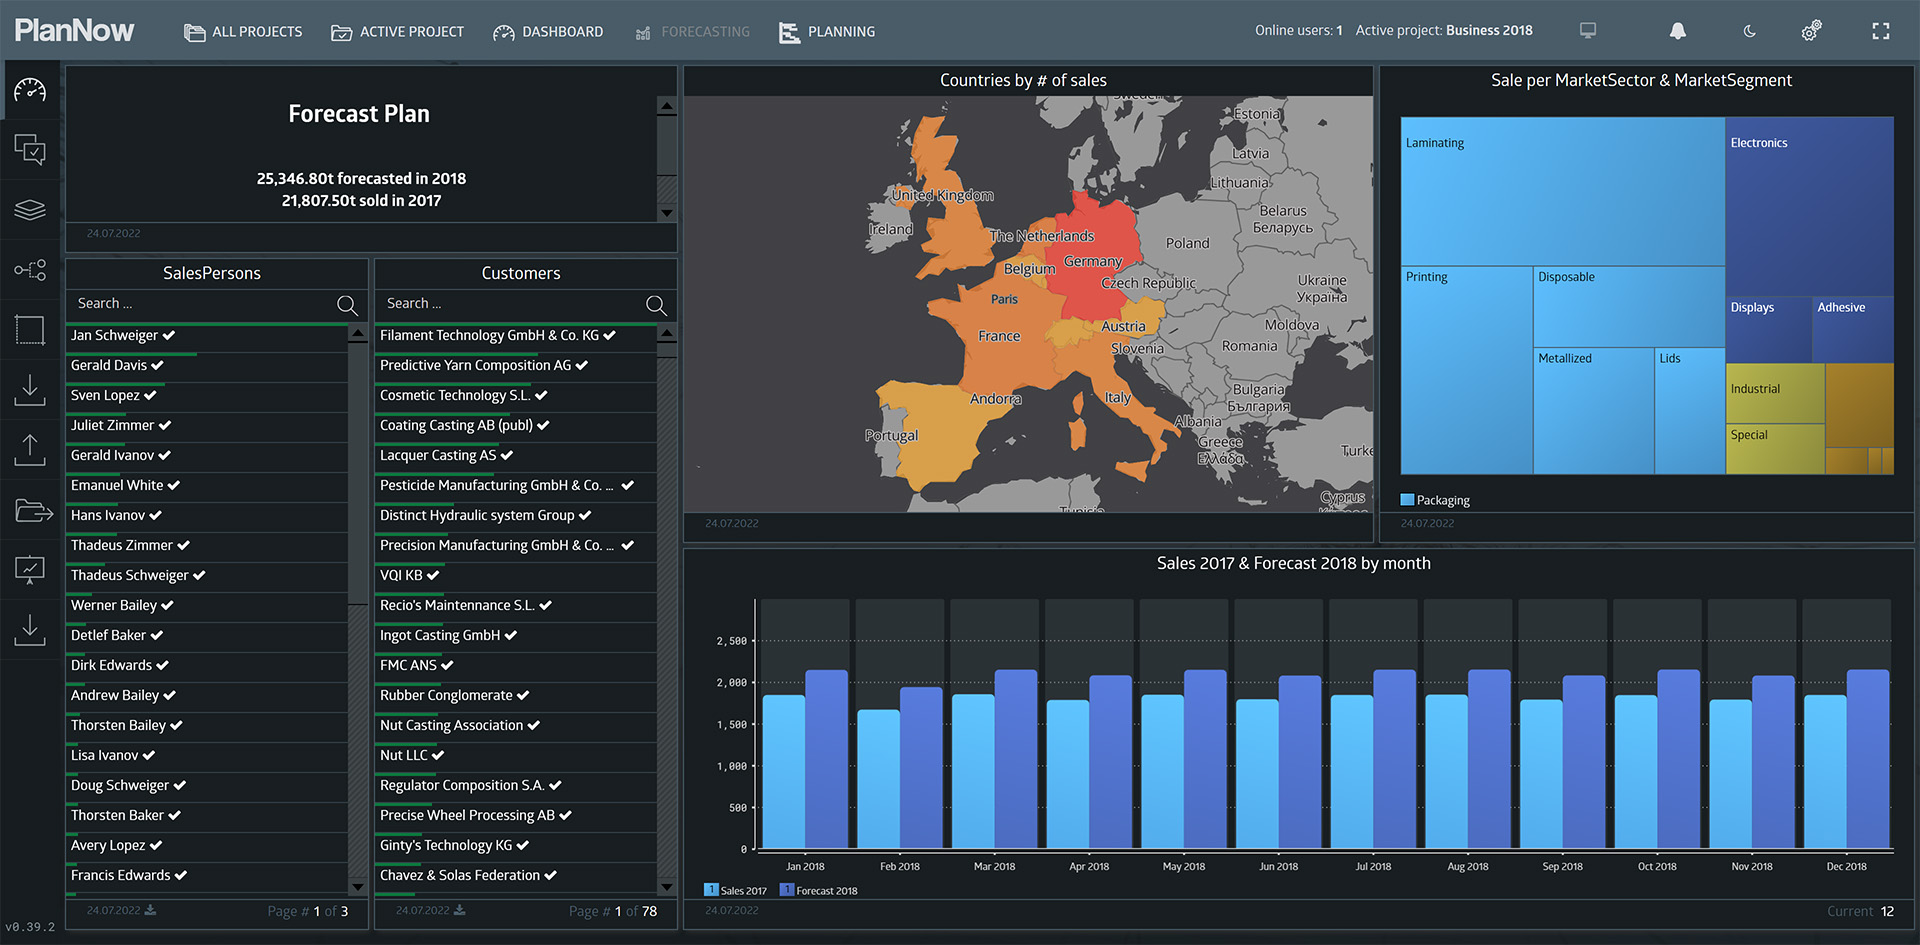
Let’s jump directly into the application and have a look at our initial scenario. A scenario in PlanNow is a selection of the data you currently work with. The initial scenario is called “Forecast 2018”.
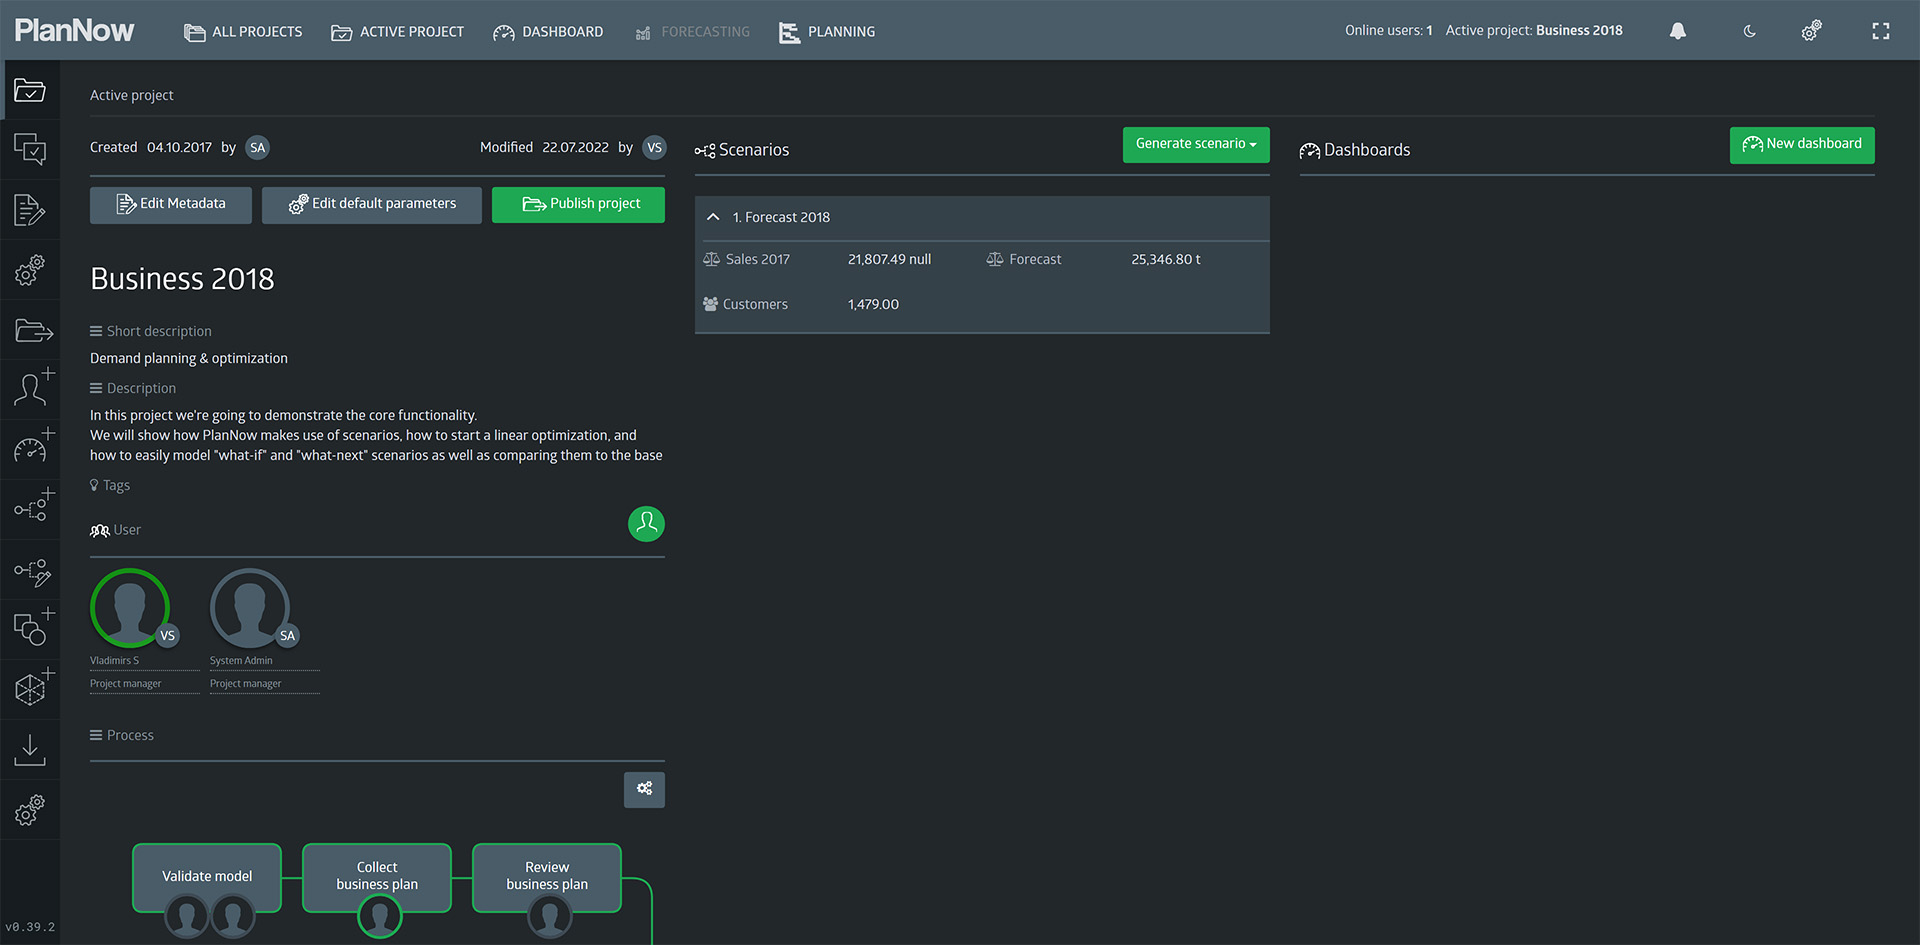
The first layer is called “Importer”. Here we can define the sources our data comes from. This can be Excel files, CSV files, Microsoft SQL databases, MySQL databases, RESTful APIs, and SAP systems.
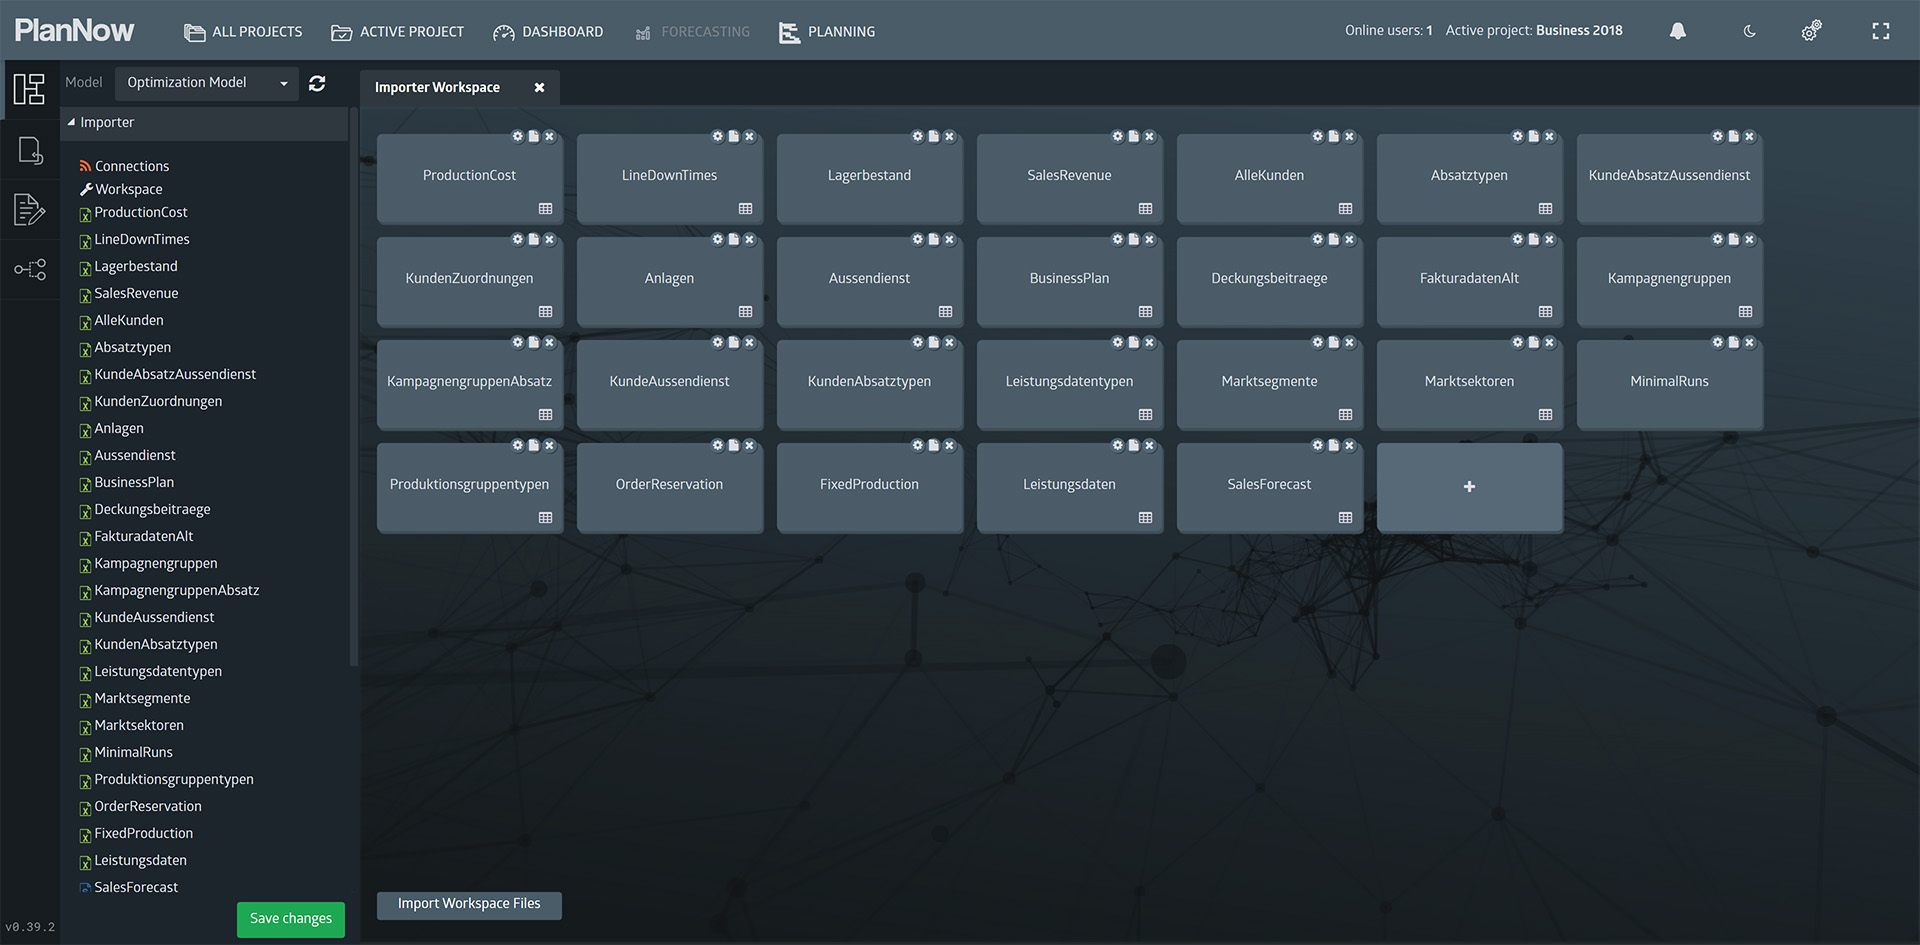
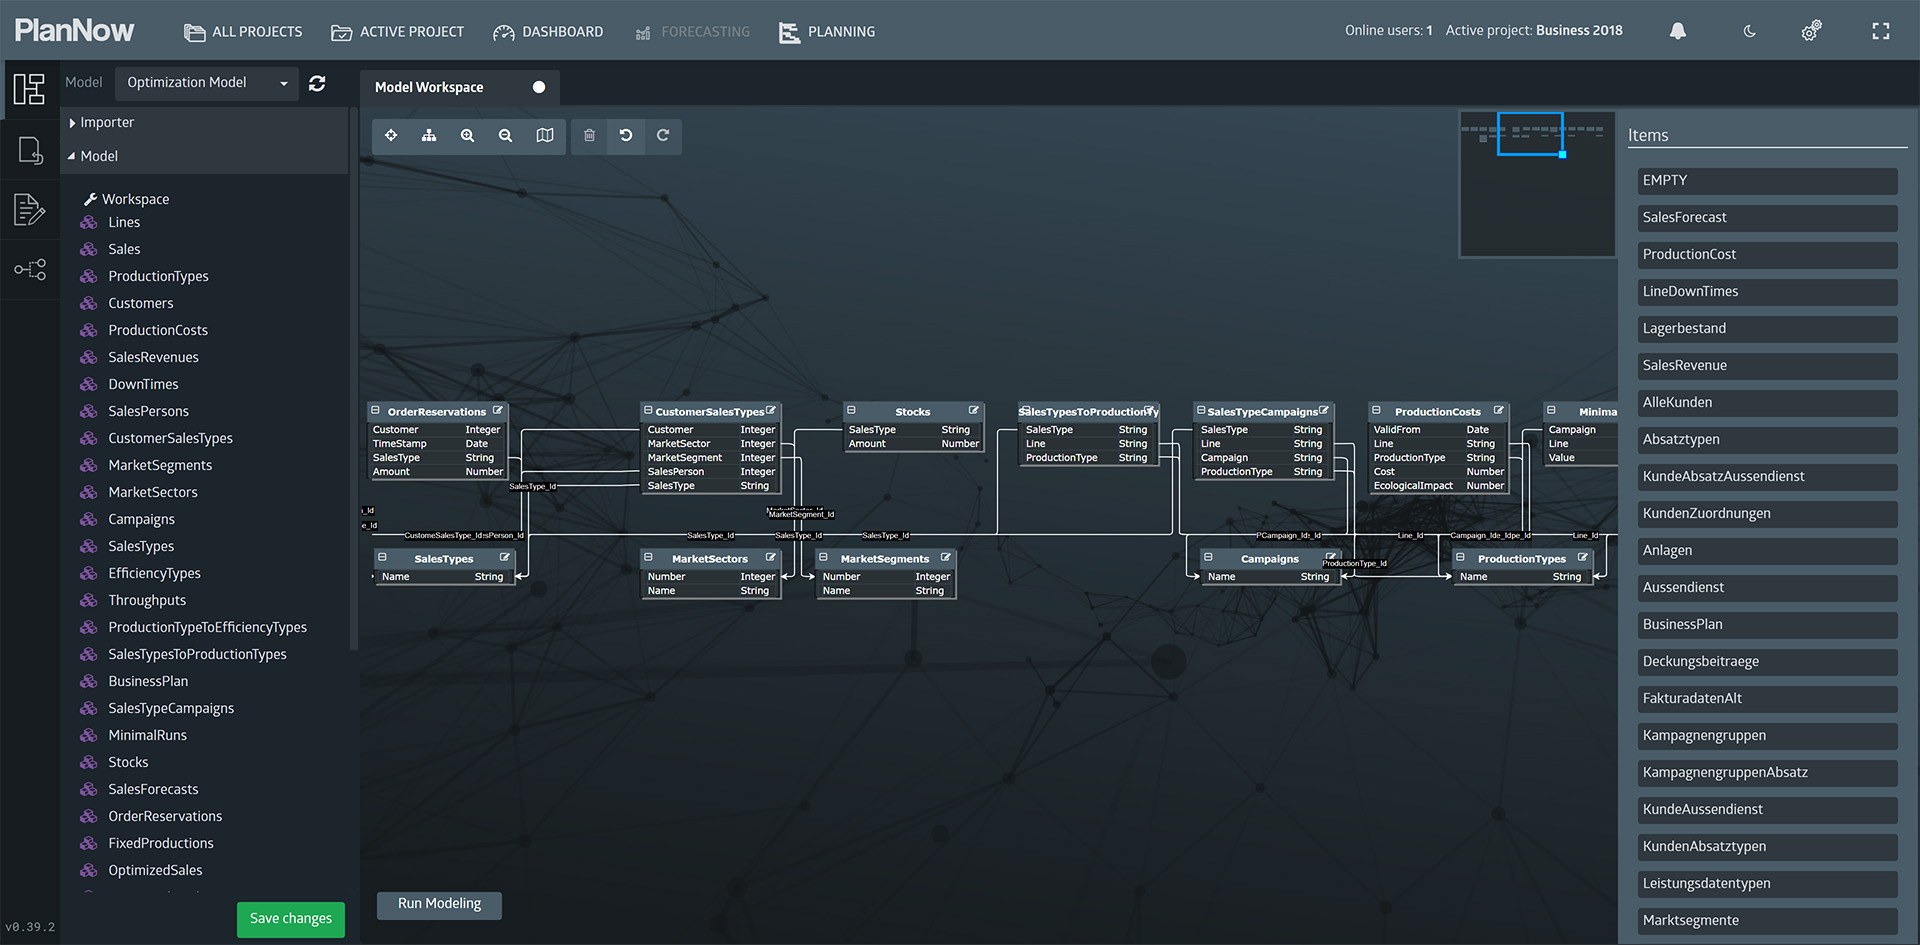
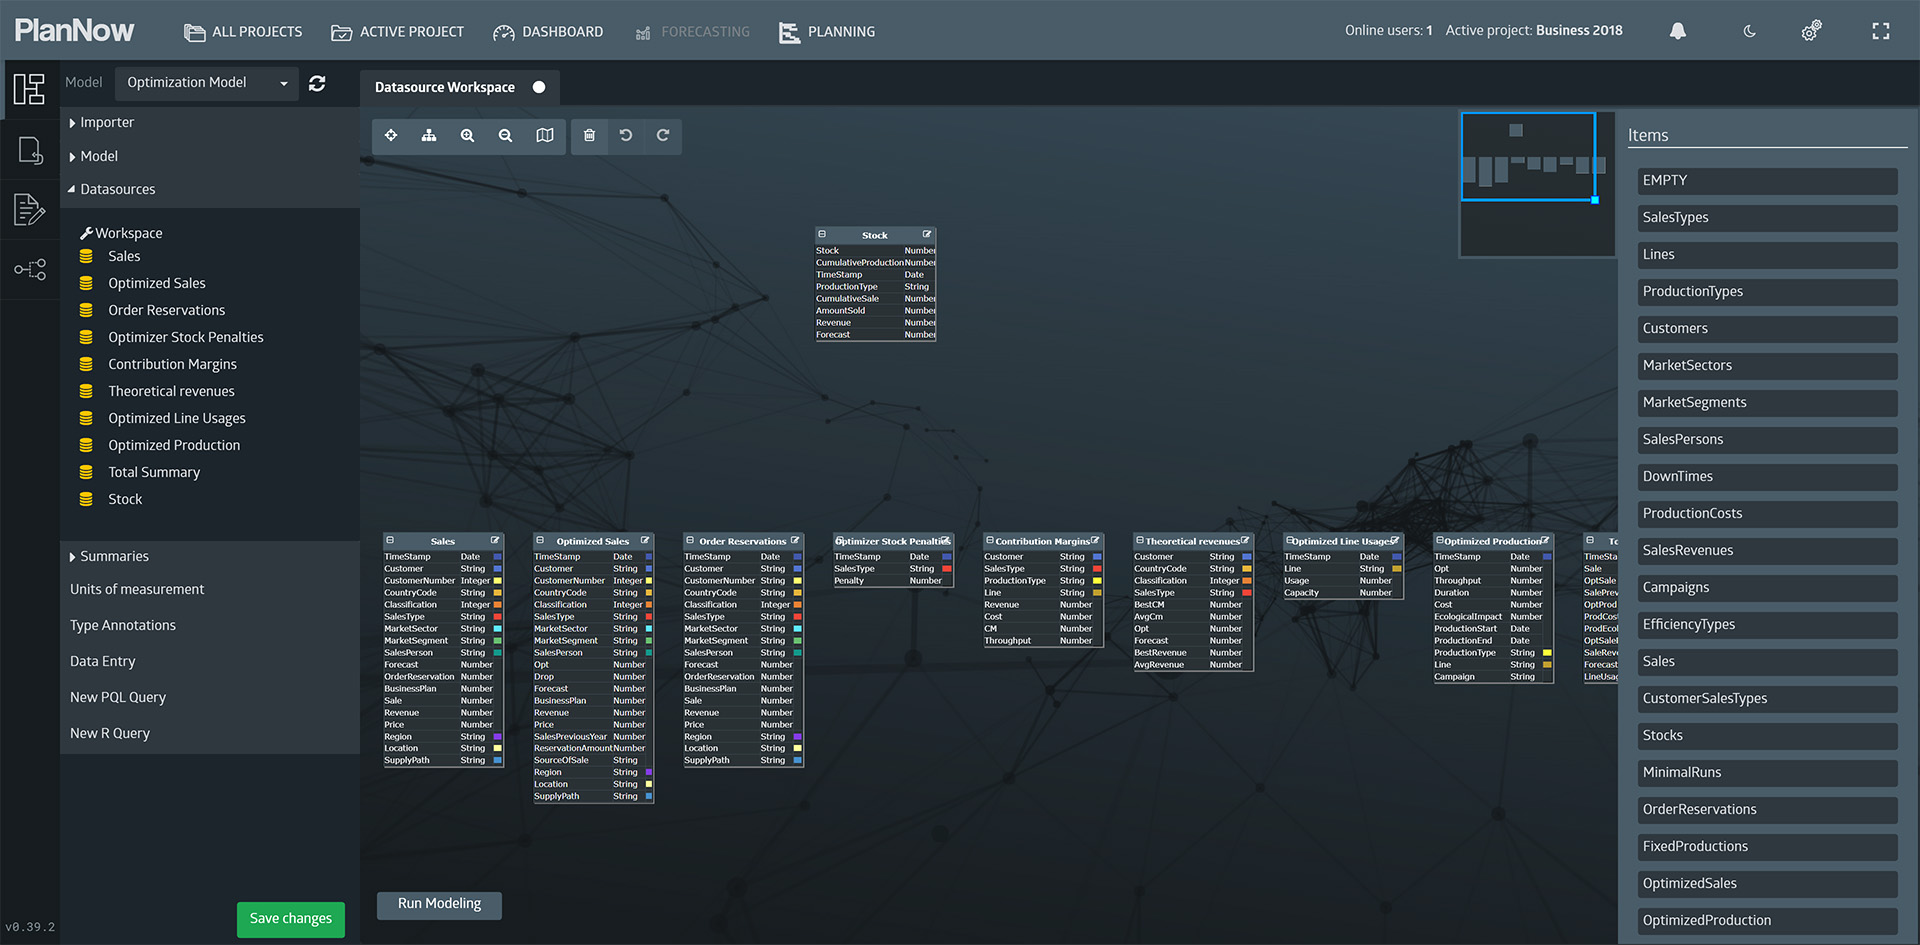
You have now seen the data flow in a model through the important three layers. There are, of course, other things that can be defined in a model, which we’ll get to another time.
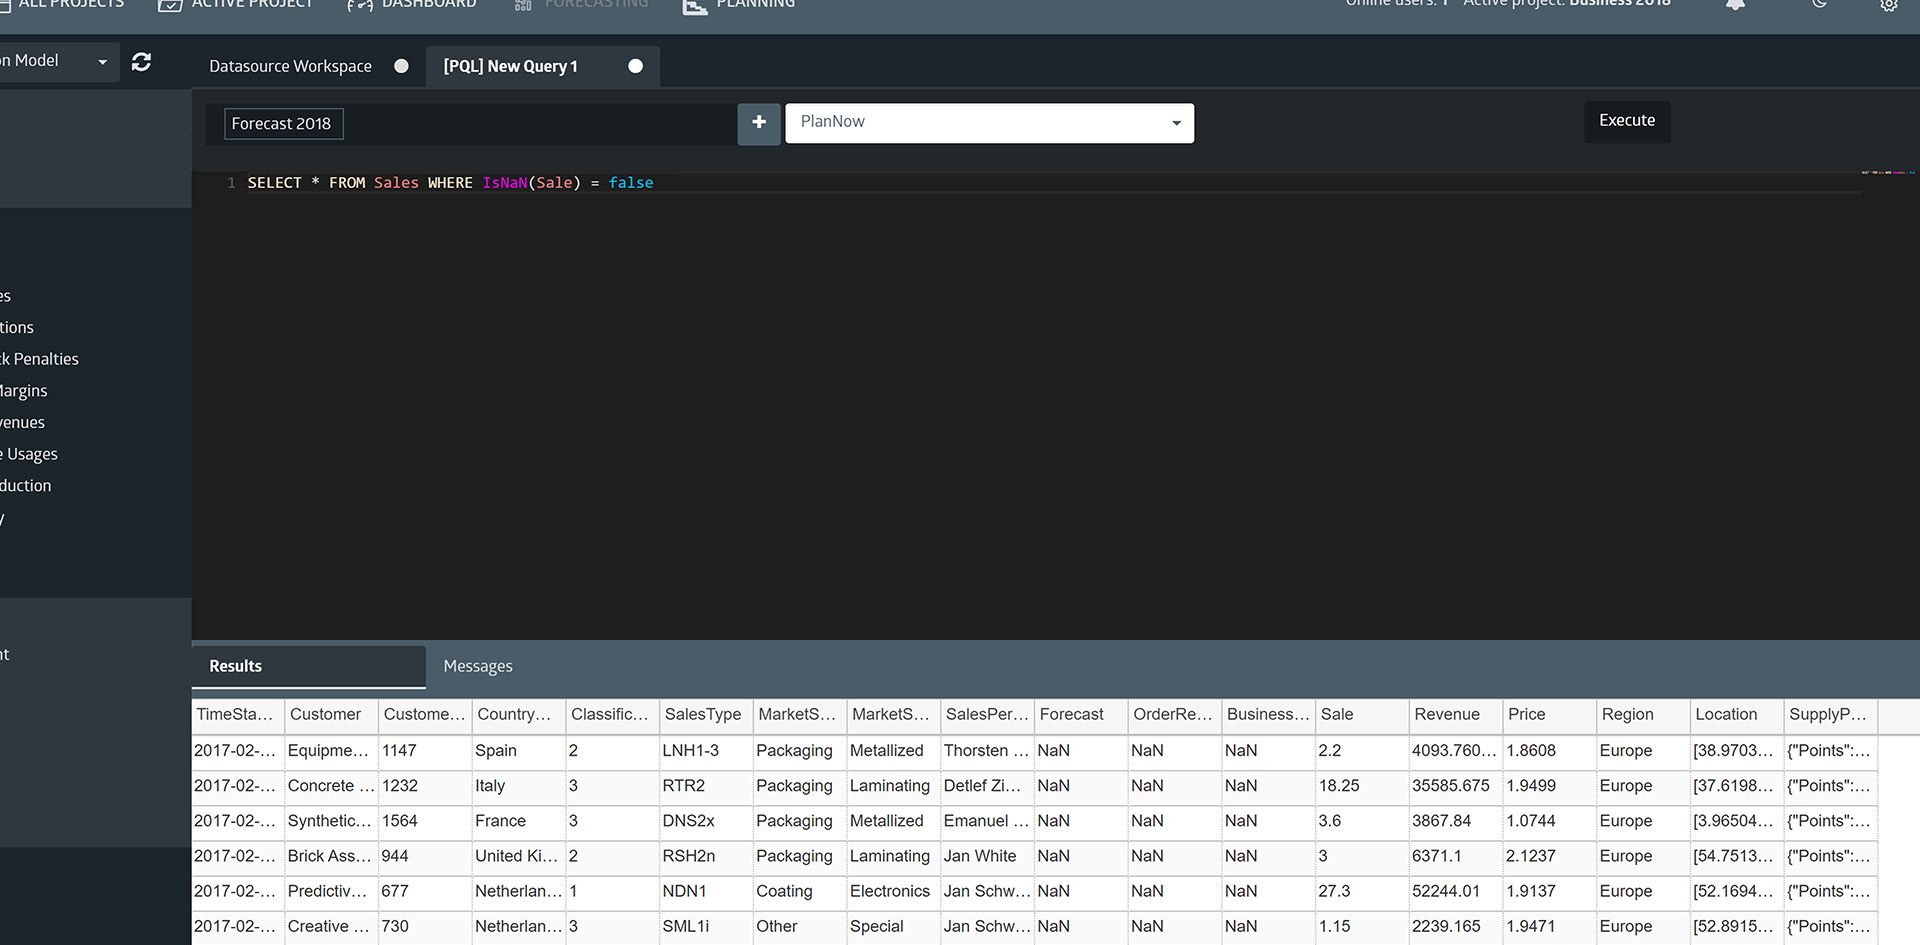
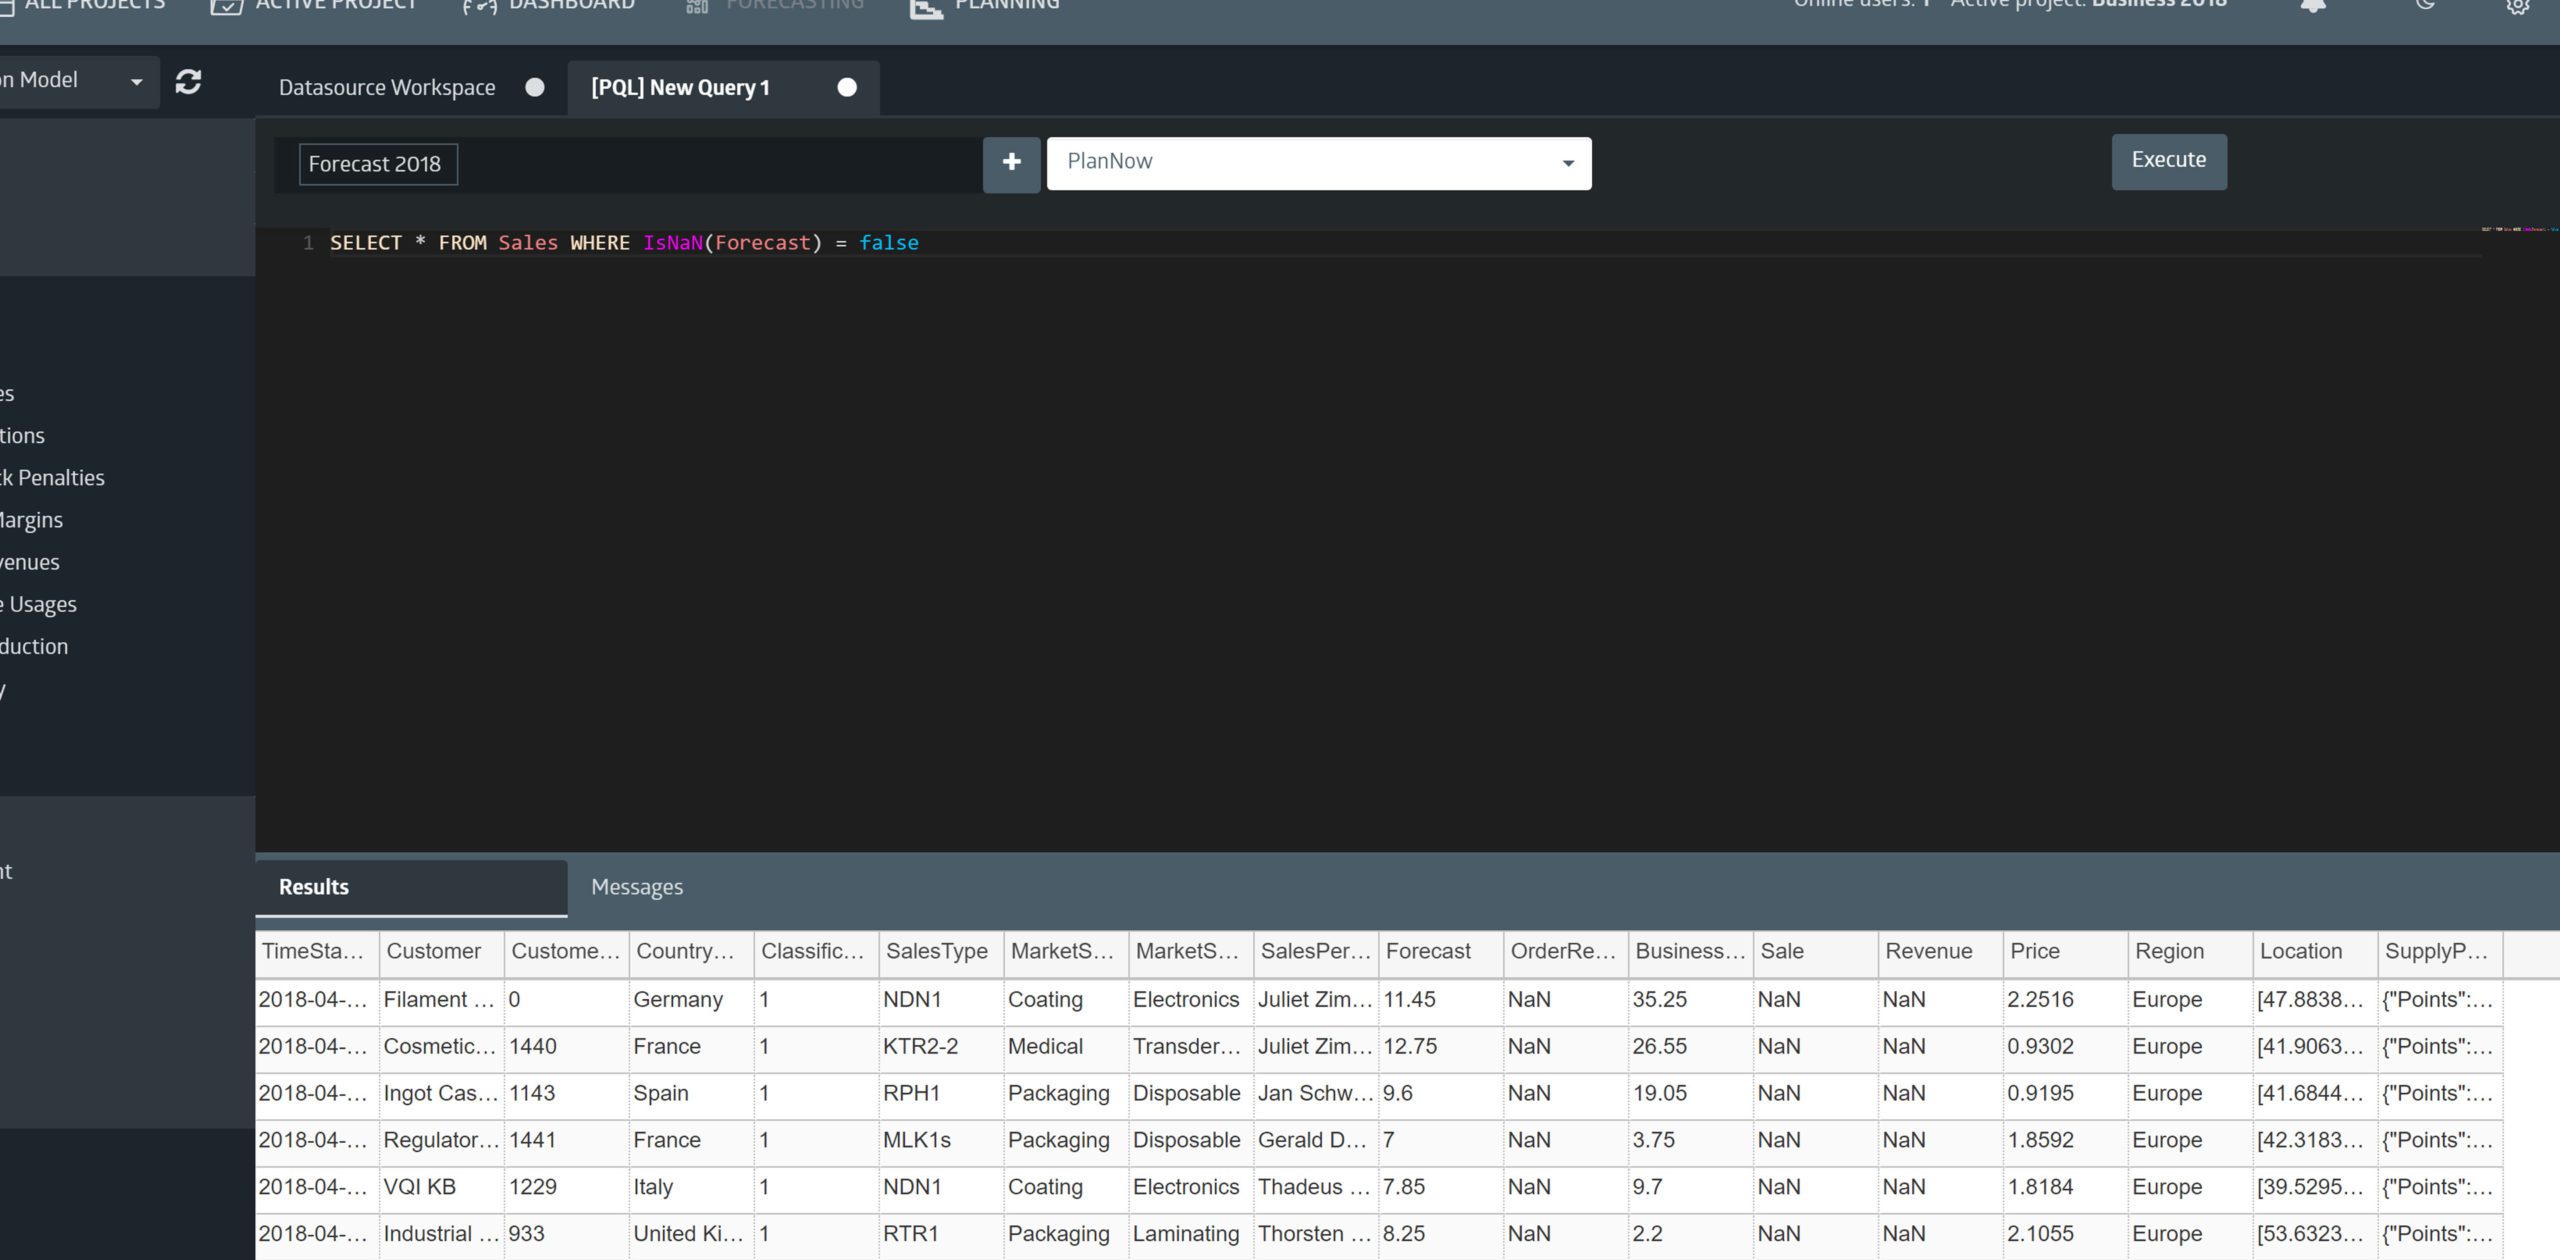
To look on some data our scenario contains, we can open a PQL query tab and run some queries. PQL is the abbreviation for PlanNow Query Language. It’s a language, for our custom in-memory database, which is used to query data.
With the following PQL statement, we can query the latest sales data from our scenario.
Contribution margin optimization
Due to the expected increase in demand in 2018, we know that we will not be able to meet all the demand in that year. Therefore, we have developed a contribution margin optimization, using a mathematical model.
We have implemented it into the PlanNow Analytics Suite, so everyone in the company can perform the optimization without advanced technical understanding. They can easily pass various parameters through input masks.

Let us look at the parameters we pass to the optimization. The first two parameters, Start Date and End Date, define the time interval in which the contribution margin will be optimized. “Factor Stock”, “Min Stock”, “Max Stock” and “Num. Periods Stock” say how different stock levels should be treated. “A customers”, “B customers” and “C customers” define the priority of the particular customer categories. “Ecological impact” is another factor that can be considered during optimization.
Let’s execute the optimization.
Contribution margin analysis
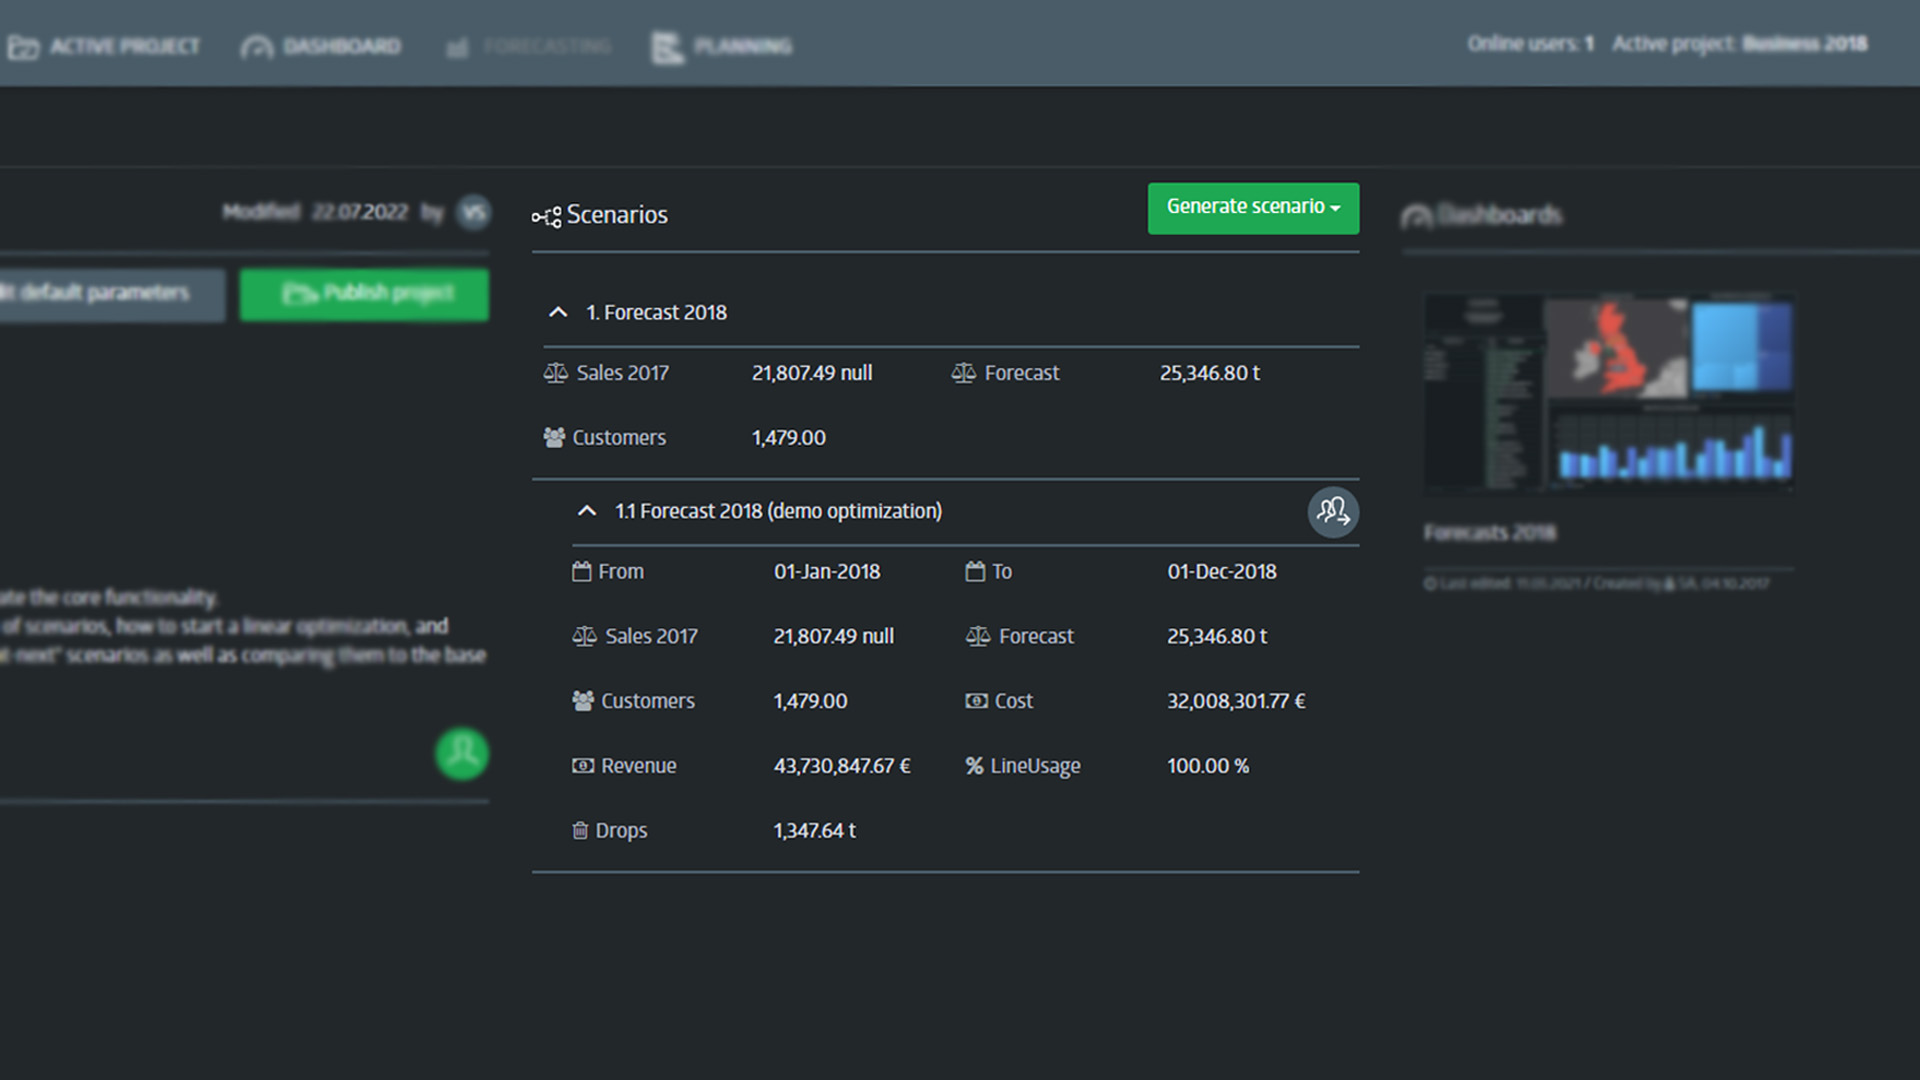
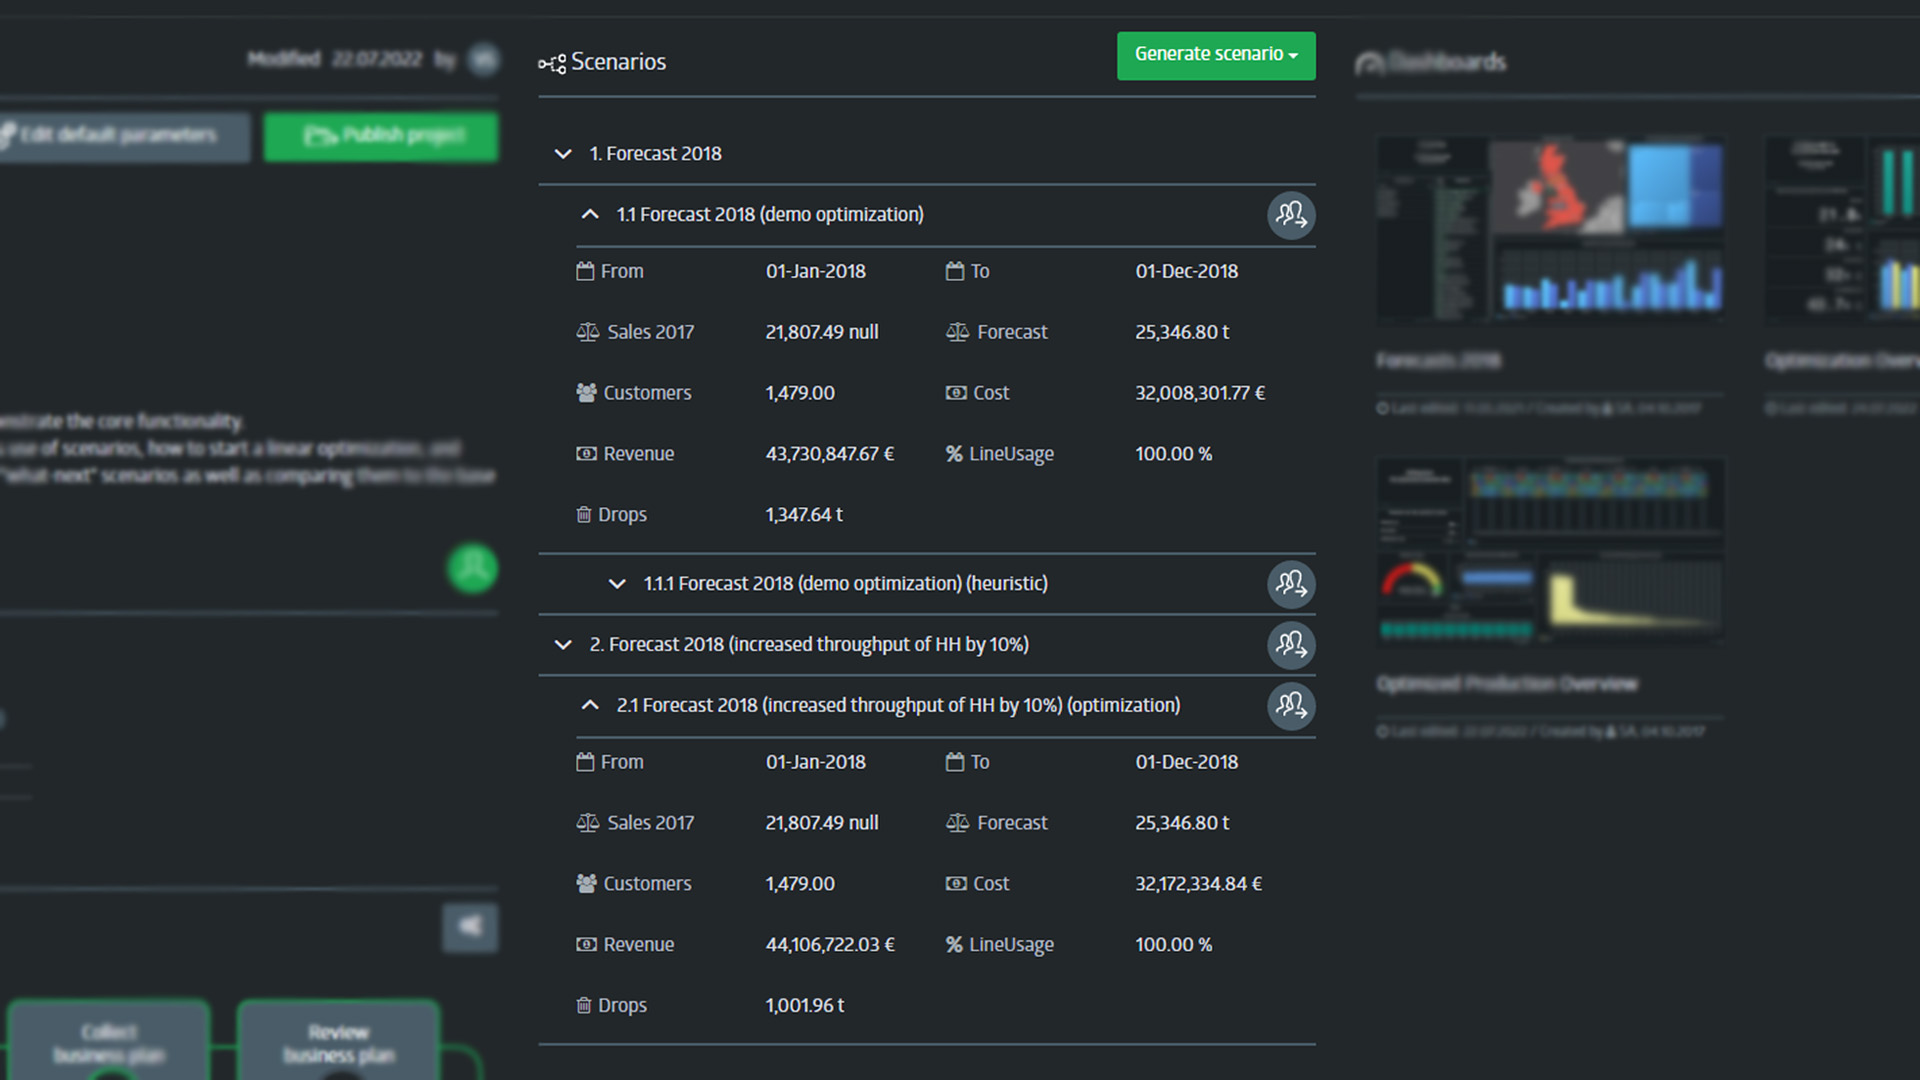
After the optimization is finished, our new scenario is created. By expanding the scenario, you can see the KPIs (Key-Performance-Indicators), which were defined in the model.
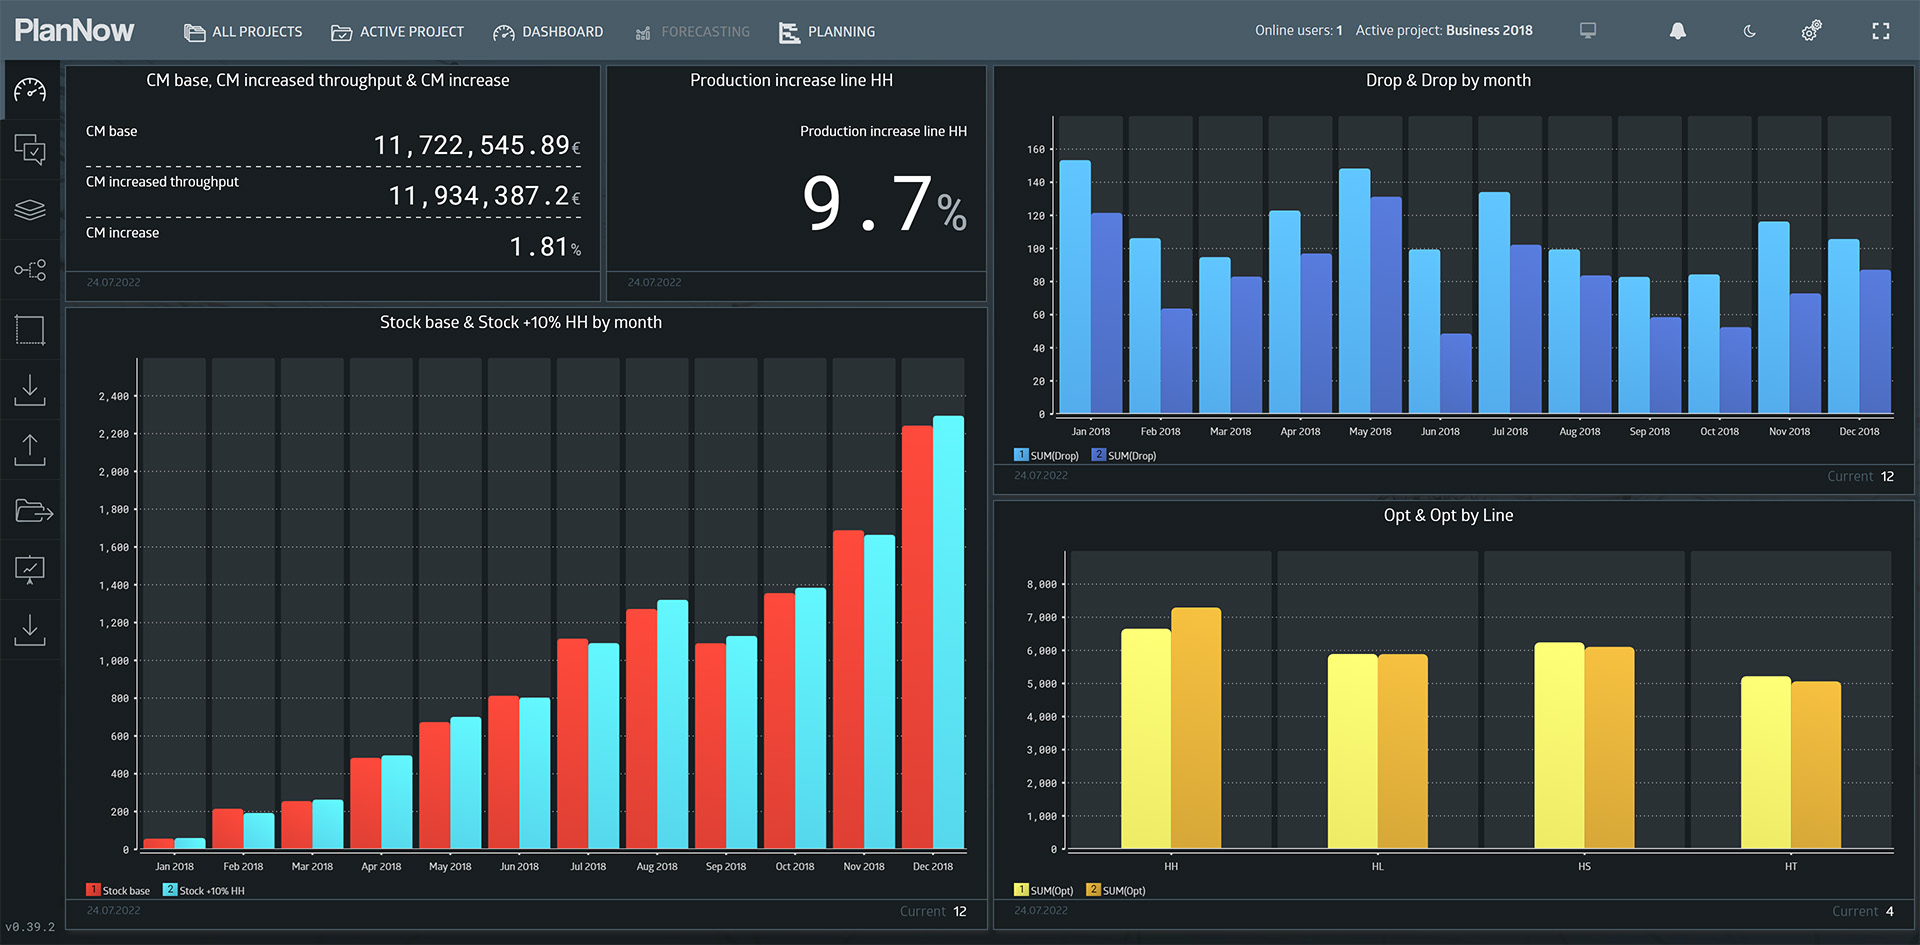
Let’s take a closer look at the result inside a dashboard.
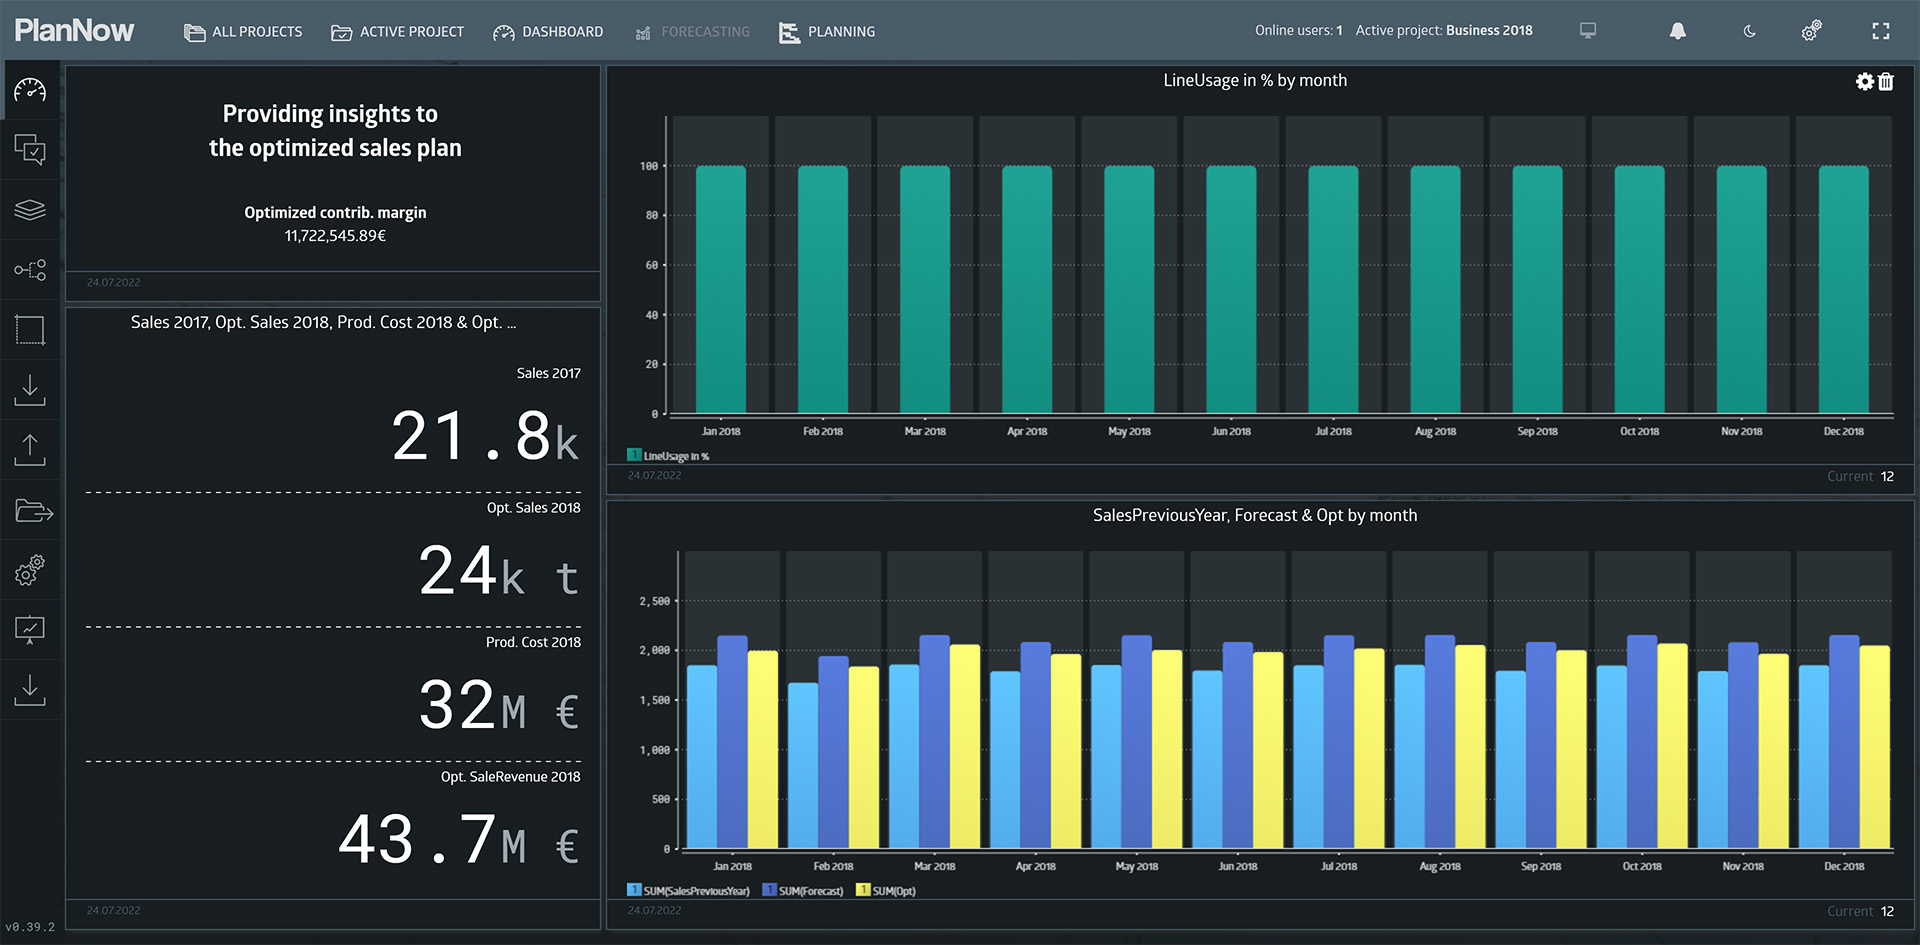
Production planning
Through the contribution margin optimization, we now know the demand we will cover. Using other simulation methods, we can successfully implement What-Next scenarios. We have developed a heuristic production planning and implemented it into our platform. Let’s execute it based on our contribution margin optimization.
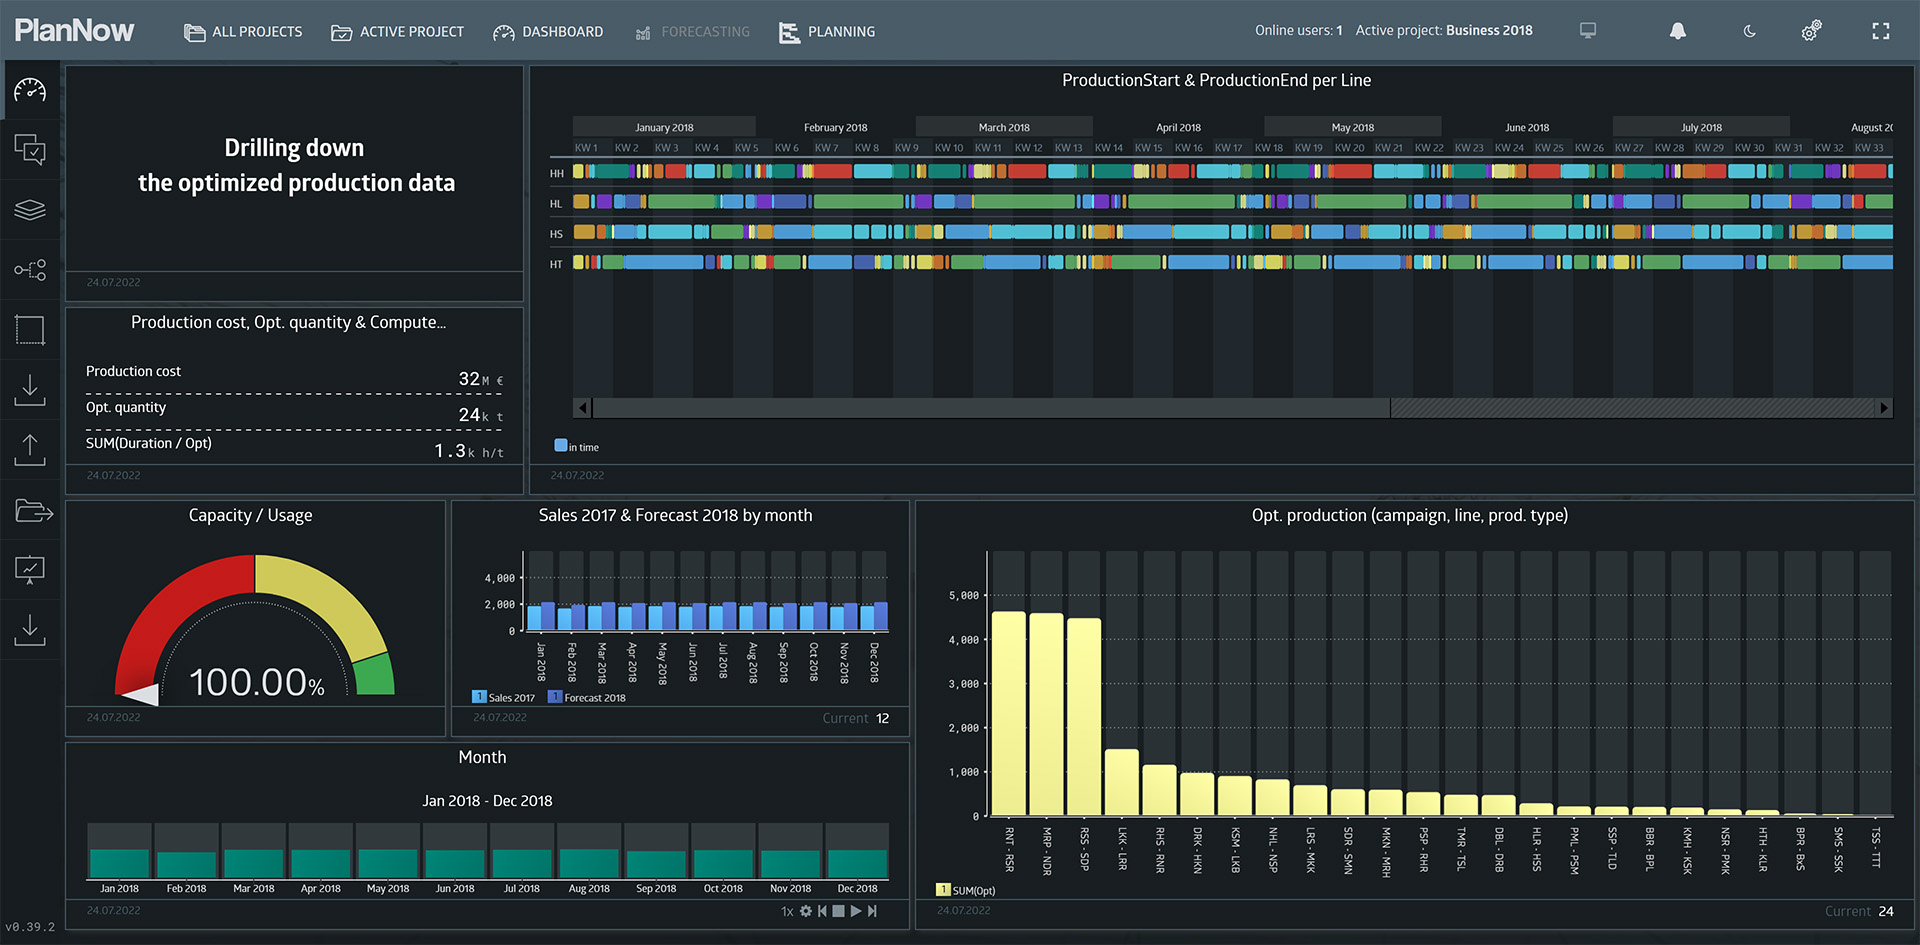
The lower right chart allows us to gain some insights about the production plan. Simply by clicking on a campaign, you can see more detailed data.
What-If scenario
Our powerful data science and machine learning (DSML) platform gives us the possibility to compare What-If scenarios simply by modifying an existing scenario.
Let’s see what happens when we increase the throughput by 10% of a production line, named “HH”. We remember, from previous data modeling, that we need to know the line ID to modify the production line. Therefore, we open the model editor again and query the table with the production lines.
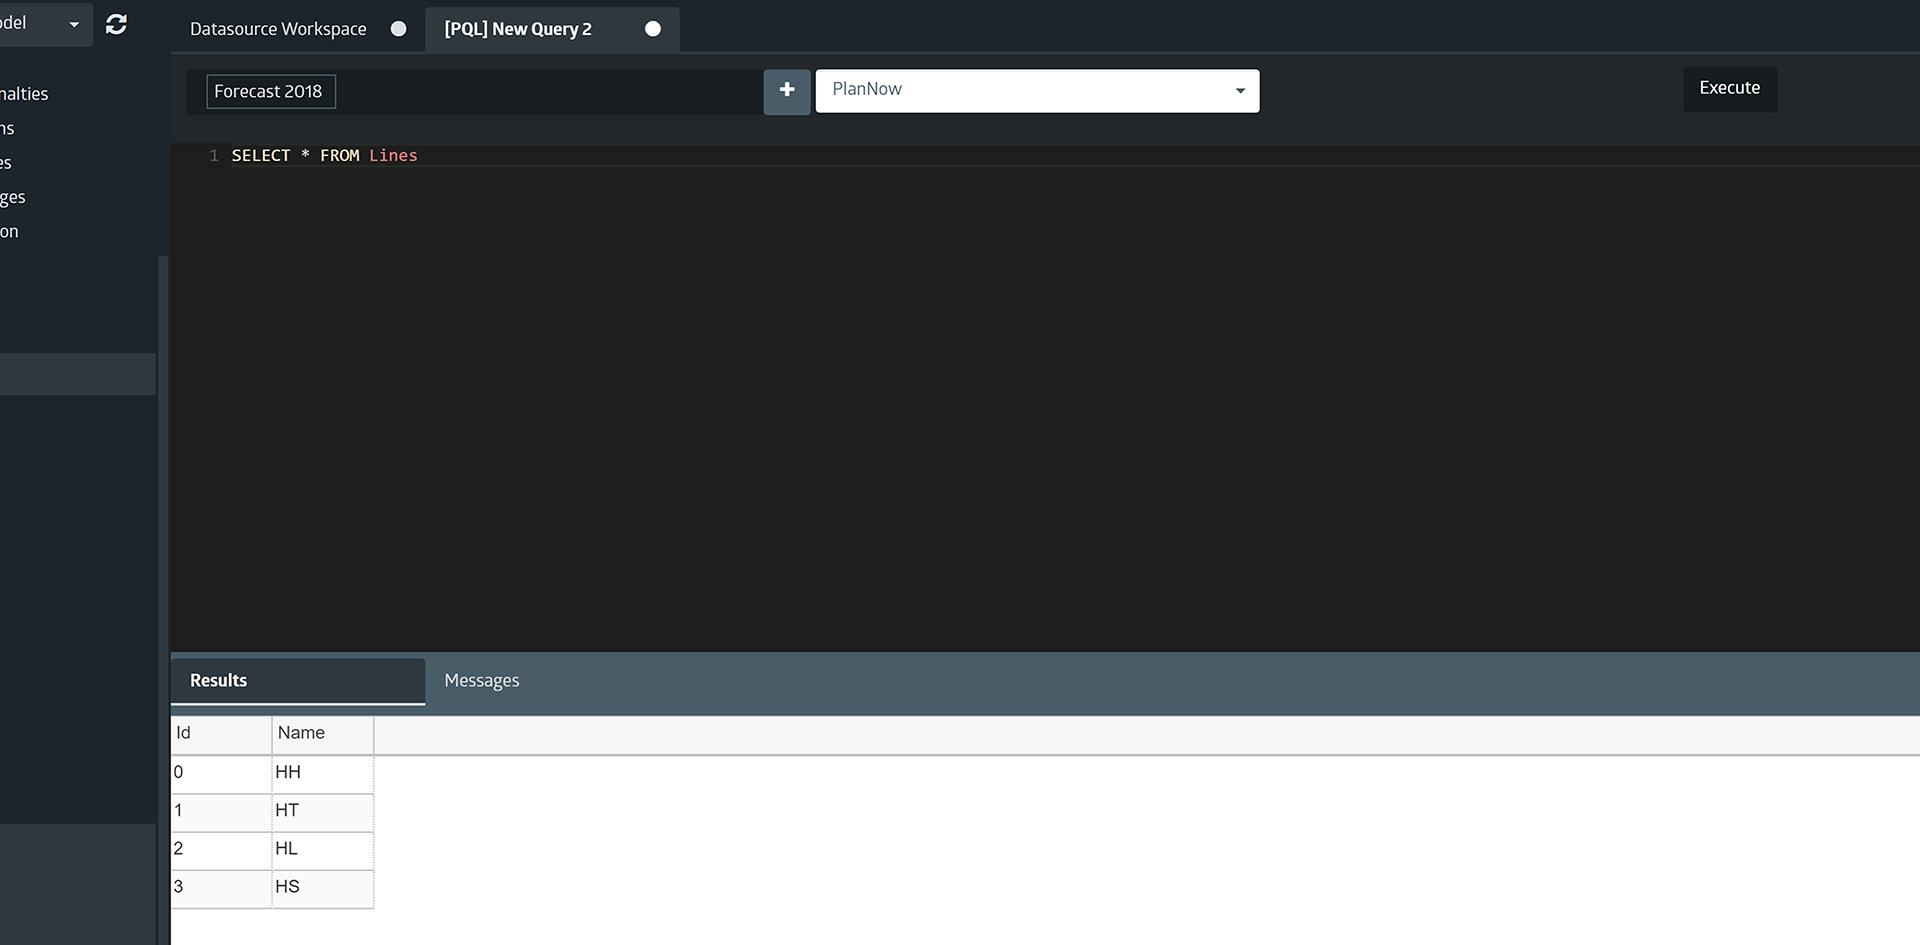
Let’s compare the KPIs from the first optimization and from the modified one. We can see that by increasing the throughput, we have about 346 tons less drops.
Summary
This case study showed you how PlanNow Analytics Suite can be used to drive your business forward with easier use of data science. This revolutionary platform helps you to gain insights from your data and provides you with data driven decision-making. It can increase your contribution margin by 3 – 5% without additional capacity.
We have shown you a snippet of our model editor and hope it has given you an idea of the many possibilities you have in there. Our platform offers many collaboration opportunities that we hope to show you another time.
To perform everything, we have shown you, no great technical knowledge is required, so even business people can work with the tools we provide.
We hope to welcome you soon on our pioneer platform. If you are interested, just send us an inquiry. Feel free to check out our blog for more case studies. See you next time.
Stay ahead of your competition!
Address
Augustaanlage 32
68165 Mannheim
Germany

